data-mining.md 2.4 KB
EliasDB Data Mining Example
This example demonstrates a more complex application which uses the cluster feature of EliasDB and GraphQL for data queries.
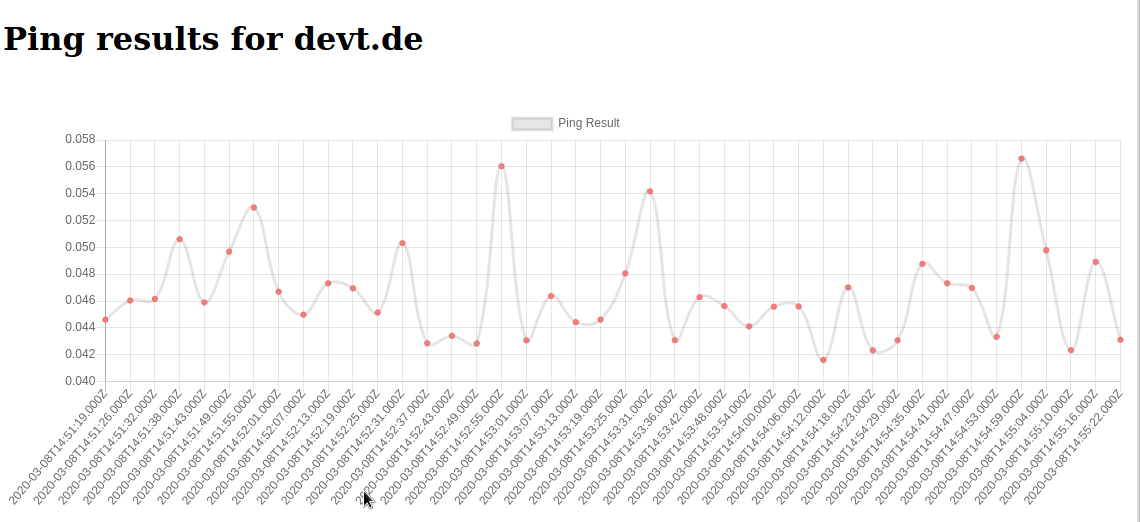
The idea of the application is to provide a platform for data mining with 3 components for presentation, collection and storage of data. The data which is being collected are request response times of the domain devt.de.
The tutorial assumes you have downloaded EliasDB, extracted and build it.
It also assumes that you have a running docker environment with the docker and docker-compose commands being available. This tutorial will only work in unix-like environments.
For this tutorial please execute build.sh in the subdirectory: examples/data-mining and run docker-compose up in the same directory.
After running build.sh you should see the following docker images in the local docker registry:
> docker images

REPOSITORY                   TAG                 IMAGE ID            CREATED             SIZE
data-mining/collector        latest              3a159822c9e6        6 minutes ago       174MB
data-mining/frontend         latest              c412dbd46dce        16 hours ago        22.7MB
data-mining/eliasdb3         latest              c079c1ad876e        17 hours ago        20.9MB
data-mining/eliasdb2         latest              b53ec5dfdcfb        17 hours ago        20.9MB
data-mining/eliasdb1         latest              83fddb8783df        17 hours ago        20.9MB
After running docker-compose up you should see 5 containers starting with the collector container continuously gathering ping results and storing it into the running EliasDB cluster.
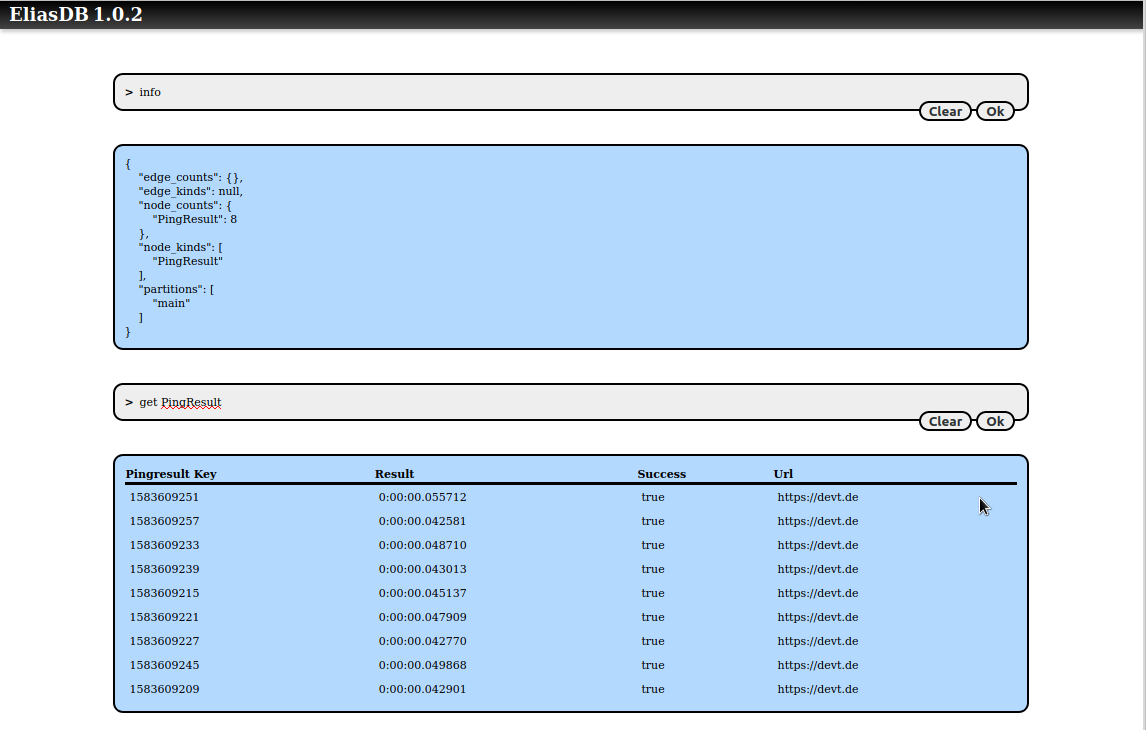
You can query the state of the database by pointing a browser at:
http://localhost:4040/db/term.html
You can query for PingResult nodes:
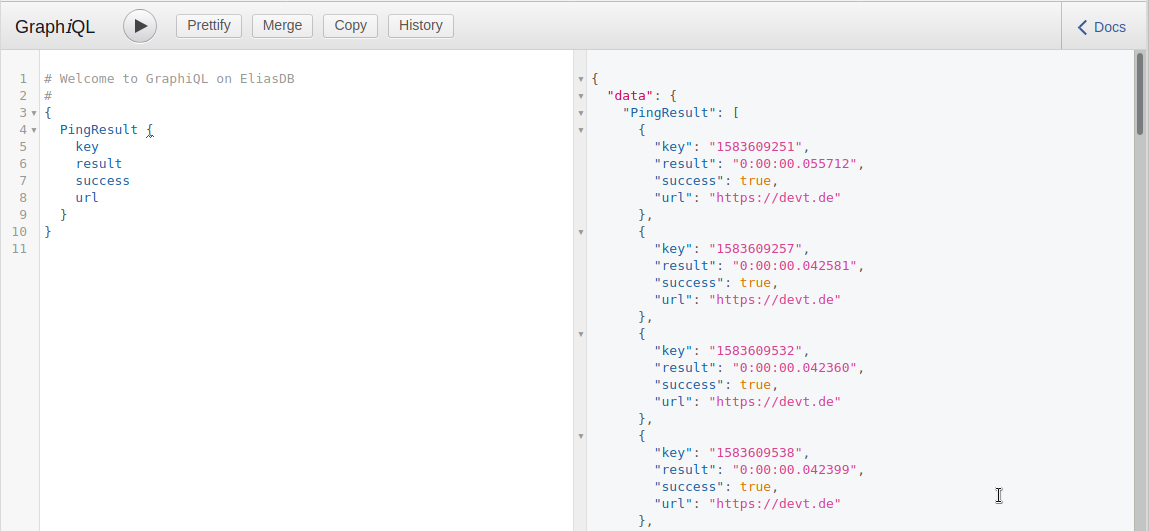
You can also use a GraphiQL interface by pointing a browser at:
http://localhost:4040/graphiql/
You can also here query for PingResult nodes:
You can log into a running EliasDB container and query its disk usage:
> docker exec -it eliasdb1 sh

/data # du -h
2.2M	./db
48.0K	./web/db
56.0K	./web
12.0K	./ssl
2.3M	.

/data # df -h
Filesystem                Size      Used Available Use% Mounted on
overlay                 240.1G     43.3G    184.5G  19% /
...
Finally you can see a graph of the collected data by navigating to:
http://localhost:4040/