|
|
vor 5 Jahren | |
|---|---|---|
| .. | ||
| .vscode | vor 5 Jahren | |
| images | vor 5 Jahren | |
| src | vor 5 Jahren | |
| syntaxes | vor 5 Jahren | |
| .eslintrc.js | vor 5 Jahren | |
| .prettierignore | vor 5 Jahren | |
| .prettierrc.json | vor 5 Jahren | |
| .vscodeignore | vor 5 Jahren | |
| README.md | vor 5 Jahren | |
| language-configuration.json | vor 5 Jahren | |
| package.json | vor 5 Jahren | |
| tsconfig.json | vor 5 Jahren | |
README.md
VSCode extension for ECAL
The extension adds support for the Event Condition Action Language (ECAL) to VS Code. The extension requires VSCode 1.50 or higher.
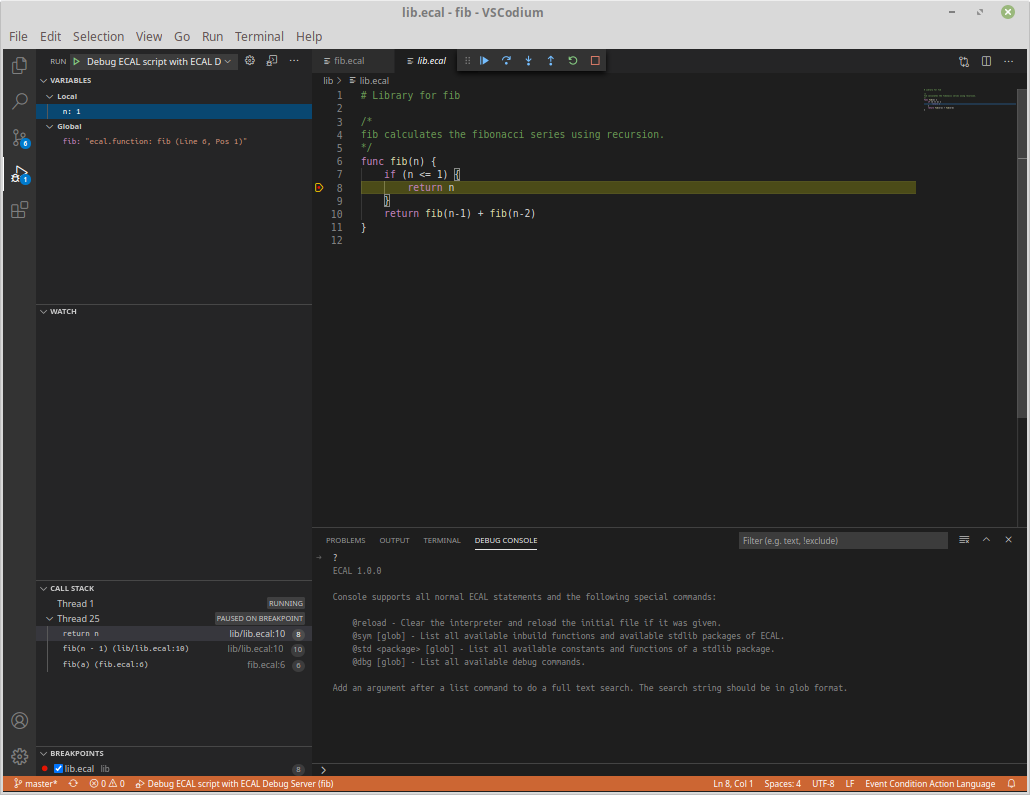
The extension supports the following features:
- Syntax highlighting
- Debugger support:
- Setting / Removing of break points
- Stepping support (step-in, step-out and step-over)
- Stack trace inspection of suspended threads
- Variable inspection of suspended threads
Install the extension
The extention can be installed using a precompiled VSIX file which can be downloaded from here:
https://devt.de/krotik/ecal/releases
Alternatively you can build the extension yourself. To build the extension you need npm installed. Download the source code from the repository. First install all required dependencies with npm i. Then compile and package the extension with npm run compile and npm run package. The folder should now contain a VSIX file.
Using the extension
The extension can connect to a running ECAL debug server. The ECAL interpreter which can run the debug server needs to be downloaded separately here. The debug server has to run first and needs the VSCode project directory as its root directory. An ECAL debug server can be started with the following command line:
ecal debug -server -dir myproj myproj/entry.ecal
The ecal interpreter starts in debug mode and starts a debug server on the default address localhost:33274.
After opening the project directory VSCode needs a launch configuration (located in .vscode/launch.json) to be able to connect to the debug server:
{
    "version": "0.2.0",
    "configurations": [
        {
            "type": "ecaldebug",
            "request": "launch",
            "name": "Debug ECAL script with ECAL Debug Server",
            "host": "localhost",
            "port": 33274,
            "dir": "${workspaceFolder}",
            "executeOnEntry": true
        }
    ]
}
- host / port: Connection information for the ECAL debug server.
- dir: Root directory of the ECAL debug server.
- executeOnEntry: Restart the interpreter when connecting to the server. If this is set to false then the code needs to be manually started from the ECAL debug server console.
Advanced debugging commands can be issued via the Debug Console. Type ? there to get more information.
Developing the extension
In VSCode the extension can be launched and debugged using the included launch configuration. Press F5 to start a VSCode instance with the ECAL extension from the development code.
The usual npm run commands for development are available:
$ npm run
Scripts available in ecal-support via `npm run-script`:
  compile
    tsc
  watch
    tsc -w
  package
    vsce package
  lint
    eslint 'src/**/*.{js,ts,tsx}' --quiet
  pretty
    prettier --write .
For more in-depth information about VSCode debug extensions have a look at the extensive extension documentation: https://code.visualstudio.com/api/extension-guides/debugger-extension
